By Ann Thivierge, Managing Director & Andrew Maggio, Vice President
Morgan Stanley Investment Management
Price-to-Earnings
 Historically, the most widely followed valuation metric is the price-to-earnings (P/E) ratio based on 12-month trailing actual earnings or 12-month forward estimated earnings. We have data for P/E based on forward earnings back to the mid-70s, however in 1988, S&P began reporting earnings estimates on an "operating" basis. Operating earnings exclude nonrecurring or extraordinary items or events such as gains and losses from asset sales, mergers and acquisition expenses, goodwill amortization and litigation costs. Operating earnings have the advantage of being less volatile than reported earnings, but it seems a bit suspect that operating earnings have been higher than reported earnings in every one of the past 22. There is significant volatility in the difference between operating and reported earnings, Historically, the most widely followed valuation metric is the price-to-earnings (P/E) ratio based on 12-month trailing actual earnings or 12-month forward estimated earnings. We have data for P/E based on forward earnings back to the mid-70s, however in 1988, S&P began reporting earnings estimates on an "operating" basis. Operating earnings exclude nonrecurring or extraordinary items or events such as gains and losses from asset sales, mergers and acquisition expenses, goodwill amortization and litigation costs. Operating earnings have the advantage of being less volatile than reported earnings, but it seems a bit suspect that operating earnings have been higher than reported earnings in every one of the past 22. There is significant volatility in the difference between operating and reported earnings,
yet, on average, operating earnings have been ten percent higher than reported earnings during expansions, and thus operating P/E valuations have been about ten percent lower.
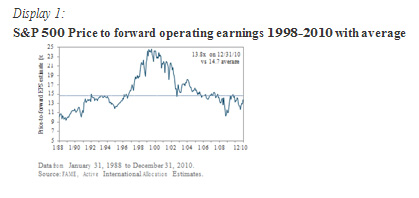
 On forward operating earnings, the S&P looks reasonably priced versus the past 22 years. But as Display 1 shows, P/Es from the past two decades have been unusually high and volatile. On forward operating earnings, the S&P looks reasonably priced versus the past 22 years. But as Display 1 shows, P/Es from the past two decades have been unusually high and volatile.
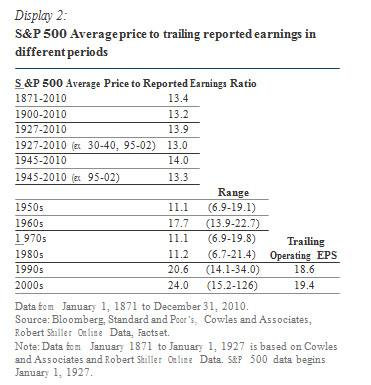
Display 2 shows S&P average trailing reported P/E ratios over different periods. Although there is some variation, long-term average P/Es generally fall between 13x and 14x3.
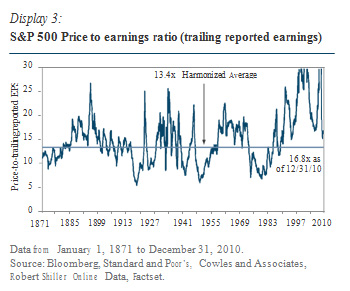
Display 3 shows P/E based on trailing reported earnings from 1871 to 2010. The current S&P trailing P/E of 16.8x is roughly 20% above the historical average of 13.4x.
Inflation is Key
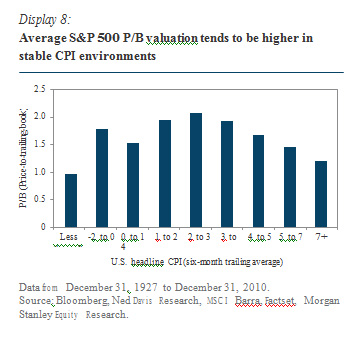
While the current S&P trailing P/E multiple of 16.8x (as of December 31, 2010) may seem high relative to the 13.4x long-term historical average, typically the inflation environment has a significant impact on valuations. Historically, in periods of benign inflation (between 1%-4% six-month average U.S. CPI) the long-term S&P trailing P/E average has been 17.2x (1927 - 2010). If we exclude P/E data from the 1995 to 2002 "bubble-era" and the Great Depression (1930 to 1940), the average P/E in times of benign inflation is 16.1x.
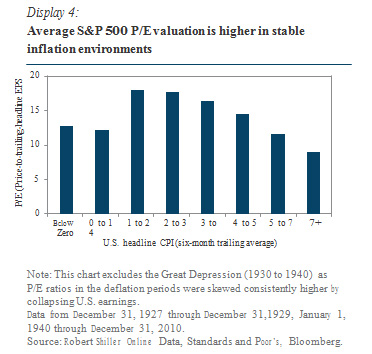
Given the history of the last 80 years, if investors are confident that neither deflation nor inflation are serious near-term
risks, 16.8x is a reasonable trailing P/E multiple. However, in periods of excess inflation (U.S. CPI over 4%) or deflation (less than 1%), the average S&P multiple falls sharply to 11.2x (post-1927). Thus, the success or failure of Chairman Bernanke's quantitative easing measures could have a significant impact on market valuations in the years ahead.
Normalized P/E
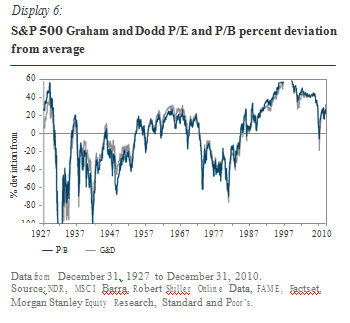
A big drawback of P/E ratios is the volatility of earnings, particularly during and immediately following recessions. A recent example is the 2007-08 recession: S&P reported earnings fell more than 90% peak to trough sending P/Es above 120! In order to "normalize" the P/E, the Graham and Dodd P/E ratio uses rolling ten-year average earnings. On this basis, the S&P is currently trading at 25.3x (as of December 31, 2010), around 32% above the post-1927 average and about 18% above the average during benign inflation environments. As we turn to the asset-based measure of price-to-book (P/B) in the next section, it is interesting to note that the Graham and Dodd P/E generally looks similar to P/B in its deviation from historical average valuations (Display 6).
Price-to-Book
The price-to-book ratio (P/B) is the ratio of the current market price to the total balance sheet value of tangible corporate assets less liabilities, and, as it is conventionally computed, values most assets at cost less depreciation and does not include intangible assets such as brand value. Book value does not fluctuate nearly as much as earnings, but also does not provide any information on profitability.
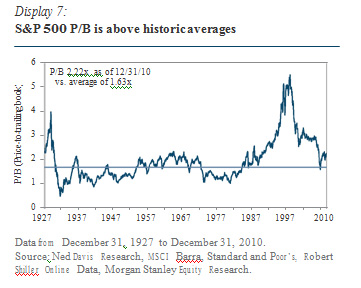
As of year-end 2010, the S&P valuation on P/B was more expensive, relative to history, than on trailing P/E. The current S&P P/B of 2.22x is roughly 27% above the post-1927 average of 1.63x (Display 7).8 If one narrows the historic comparison to only periods of moderate inflation (CPI less than 4% or over 1%), the current P/B is roughly 10% above the 2.0x long-term average.
Return on Equity
As noted above, at year-end 2010, the S&P could be considered slightly cheap relative to long-term average P/E multiples in stable inflation environments. But the S&P is10% expensive compared to average P/B multiples in similar periods (as of December 31, 2010).
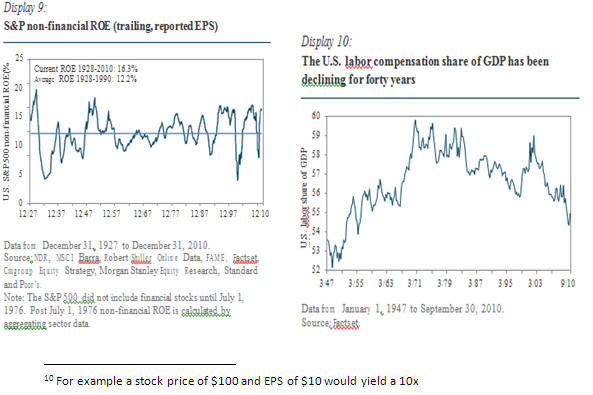
Mathematically, the link between the price the market will pay for earnings (P/E) and the price it will pay for net assets on the balance sheet (P/B)is the Return on Equity (ROE). ROE is equal to earnings per share divided by book value per share. It attempts to measure the rate of return on assets, or how efficient a firm is at generating earnings off of its asset base. If a firm increases its efficiency or earnings power, its P/E would fall absolutelyand relative to P/B.
Free cash flow yield
Another measure that has become increasingly popular in the past ten to fifteen years, is free cash flow (FCF) yield.
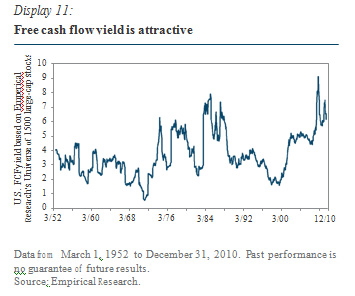
FCF yield can be used to determine the true amount of "cash available for investors," or cash (as opposed to accounting earnings) available for distribution to security holders. There are various methods for calculating FCF yield, but most tell a very positive story (Display 11). According to Empirical Research data, compiled on 1,500 U.S. stocks, U.S. FCF yield is near 60-year highs (as of December 31,2010). Furthermore, FCF yield looks better compared to history than EPS yield (which is earnings per share divided by stock price - the inverse of P/E). This indicates that corporations are converting earnings to actual cash at a higher rate than in the past. Current high FCF could be a function of a historically low cost of capital, better corporate management, or low corporate investment following two recessions in ten years-or it could be a "new normal." To use the current high FCF yield as an indicator of long-term value, one would have to assume that the current trend is sustainable, but as can be seen below, FCF yield certainly offers near-term valuation support for the market.
Stock vs. Bond Valuation
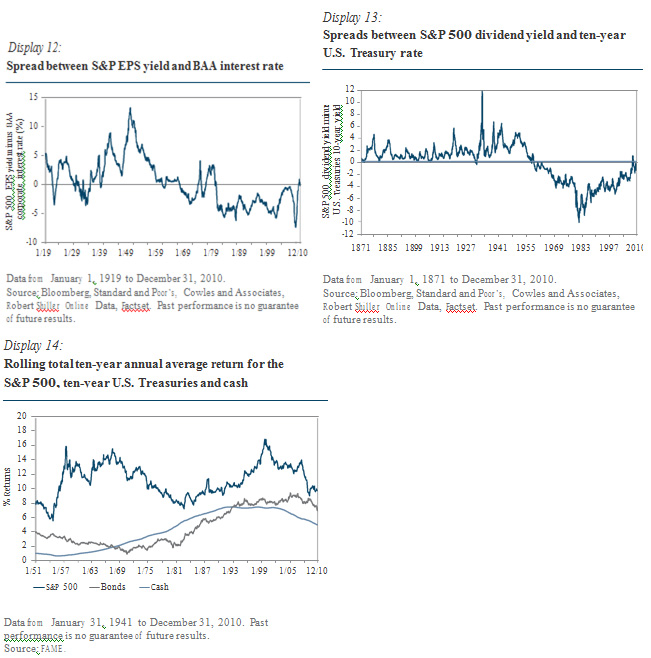
Equity valuations are often compared to their most liquid investment alternative - bonds. This is usually done by comparing the earnings yield to the bond yield. Display12 shows the spread between S&P 500 earnings yield and BAA bond yields from 1919 to 2010. As of year-end 2010, the earnings yield on the S&P was 5.8% versus a ten-year BAA bond yield of 6.1%. Equities have not looked this attractive relative to bonds since the 1970s. The S&P dividend yield is also approaching the U.S. ten-year Treasury rate for the first time in forty years (Display 13) However, before 1960 current spreads between equity and bond yields were normal as investors required a yield premium to take on equity risk. It is not clear whether the current equity versus bond yield relationship represents equity value, or a return to the pre-1960 norm.
Final Considerations
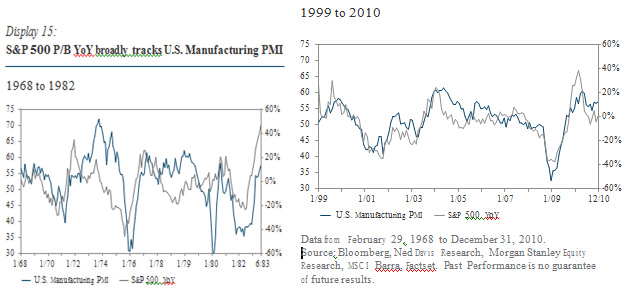
Valuations can deviate from historical averages for many years. In fact, typically, the near-term economic cycle is usually a more significant driver of equity direction than valuation. Regardless of value, equities tend to do better when short-term economic prospects are improving and worse when they are deteriorating. While the study of historic valuation can give us targets for the market to gravitate towards over time, it is likely that the bulk of any upward or downward adjustment will occur during a corresponding change in economic growth prospects. The direction of economic momentum is particularly important during periods when equities are making little headway over a multi- year period, as was the case during the 1968 to 1982 secular bear market (Display 15). With the S&P now flat since 1999 and large secular overhangs still clouding the longer-term equity outlook, there is a good chance we are currently in a similar sideways market. In fact, U.S. manufacturing PMI has correlated closely with year-over-year changes in S&P P/B over the last twelve years (Display 15), though the market over the entire time frame has made little headway. Given that equity valuations do not look excessively overvalued or undervalued, and yet there is high uncertainty about the growth and inflation backdrop, it would not be unusual if equity markets move with the business cycle until the longer- term secular backdrop becomes clearer.
Conclusion
As of December 31, 2010, the S&P 500 was trading at roughly 16.8x 2010 headline EPS compared to a long- term average of 13.4x, and an average P/E during benign inflation of 17.2x. In the near term, historic valuation averages may not matter if the nascent economic cycle remains on track and inflation expectations remain stable. However, the average P/E multiple when U.S. CPI is below 1% or above 4% has been 11.2x. It is also notable that equity valuation looks less attractive on a P/B than on a P/E basis, reflecting the fact that ROE is currently higher than historic averages. P/B metrics would be more relevant than P/E if one expects ROE to mean revert over time.
While cyclical bull markets can last for years during economic expansions, even within secular bears (e.g. 1932 to 1937, 1974 to 1977, 2003 to 2007), it can be hard to make a strong medium-term valuation case for equities from these levels if one believes the economic cycle will be volatile or ROE will come under pressure. Equities arguably look cheapest in comparison to bond yields, but, as we saw, even that comparison is period-dependent. Ultimately, we think equity valuations could move higher with the current economic upswing, but at these levels, valuations are vulnerable to any disappointment on inflation, corporate profitability, or economic growth.
|

