We were consistently overweight equities over 2019 after buying aggressively in late 2018’s recession scare. Low inflation allowed central banks to ease policy, setting the scene for a new mini cycle upswing in 2020. Near-term risks remain – including a flare up ingeopolitical tensions, trade friction or bad news on the coronavirus outbreak – but we would probably buy dips. Investors looking to generate growth while mitigating losses during inevitable periods of stress should consider a volatility-capped approach.
Long business cycle to extend further
This is already the longest expansion in the US economy on record but a new round of monetary easing looks set to deliver the fourth mini cycle upswing since the 2008/9 recession. The US housing market is strong, global consumer spending is holding up and business confidence is starting to rise – especially in the UK where the risk of a No Deal Brexit has been deferred to December 2020.
Investment Clock in early Overheat
A rise in inflation lead indicators has pushed the Investment Clock model that guides our asset allocation into Overheat but we expect the ongoing structural slowdown in China to keep commodity prices under control and we see little near term prospect of interest rate rises. There are parallels between this expansion and that of the 1990s when it was the slowdown in Japan that helped keep inflation and interest rates low in the rest of the world. The parallels don’t end there. The technology sector is again leading the charge on Wall Street.
Buying dips
Fundamentals are positive but you can never rule out a correction. Risks include a flare up in geopolitical tensions, trade friction or bad news on the coronavirus outbreak. We would probably buy dips, moving equities further overweight.
Capture not correlation
Investors looking to generate growth while mitigating losses during periods of market stress could consider the sort of volatility-capped approach we employ in the Multi Asset Strategies Fund (‘MAST’). Our aim is to capture positive market trends while limiting the downside in bear markets, a feature asset classes with a low day to day correlation don’t always offer.
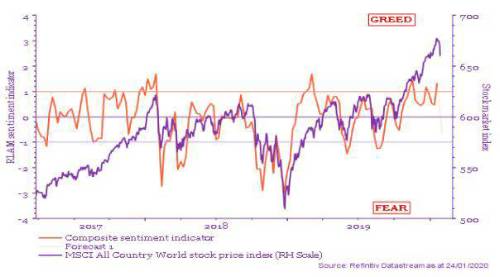
Chart 1: Global stock prices and RLAM sentiment indicator
Source: RLAM. Composite sentiment indicator includes factors related to market volatility, retail investor bullishness and US director dealing in shares in their own companies. A reading of -1 or lower indicates a contrarian buy signal.
|


