By Alex White, Head of ALM Research, Redington
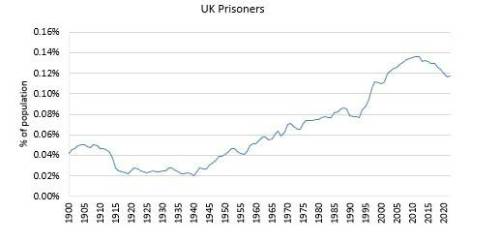
There have been some dips, such as WW1, but in general the trend is clear, and statistically significant, with a p-value of 2%.

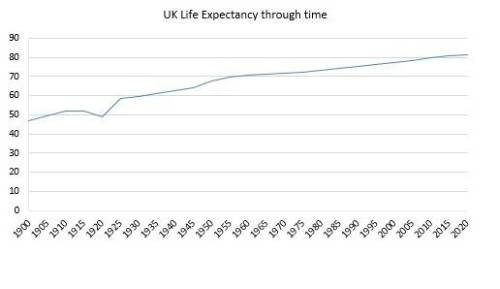
However, this is only half the picture. Since 1900 demographic and mortality changes have been dramatic, with medical advances like antibiotics, the NHS and welfare, cleaner air, and so on. While we may be skeptical of the precise figures, we have many more people living longer and far lower infant mortality. Statista has the following data at each 5y point for life expectancy.

There are two key ways life expectancy has risen. Lower child mortality and older people living longer (there are other effects, but even in the extremes, such as during the Spanish flu epidemic, these have more mitigated impacts than the general trend).
This matters, because children won’t be in prison, so this could be skewing our data materially. The reason more people are in prison could just be that more of the population are adults.
There’s no clear way to quantify this without making a few assumptions, but we can make some sensible ones. We assume that under 15s don’t go to prison, and we estimate 10m under-15s in 1900 and 12.3m in 2022 (from the population pyramids here(1), and 2021 data here(2)). We then take the overall change in the percentage of over-15s in prison from 1900, and scale up the observed standard deviation by this ratio. That is, in 1900 0.042% of the population, or an estimated 0.056% of the over-15s, were in prison.
We assume the variation in the over-15s prisoner percentages are 0.056/0.042 times as large as the variation in overall prisoner percentages. This is a fudge, but using the scaling factor from 1900 (1.3) is conservative- using the 2020 number would give 1.2 instead. With this adjustment, we still get a p-value of 5.9%- i.e. not quite statistically significant.
This is also not factoring in the other big effect, that there are now more old people. It’s both true and unsurprising that an average 60-year-old is less likely to go to prison than an average 20-year-old. This means that, after adjusting for children, a neutral expectation would be that the proportion of people in prison should be lower. The assumptions here are harder, but in 2023 over 60s made up 30% of the over-16 population and 4.6% of the prison population. Assuming the same relative criminality, we estimate a shift in the proportion of 16-59 year olds in prison from 0.06% to 0.2%. Adjusting the variation equivalently (here, scaling up by 1.66), this gives a p-value of 1.5%.
We can be fairly confident then that demographics don’t explain this shift, so it must be cultural. That is, our society has become meaningfully more eager to incarcerate people over the last 122 years. Whether this is a sensible response to crime or not, the data is reasonably clear that it’s been happening.
As a postscript, one other notable change has been the proportion of female prisoners declining from 17% to 4% over the period, with a material drop around and after suffrage. In fact, in absolute terms there were more women in UK prisons in 1903 than in 2022.
Statista Article on Prison Sentances
(1) Population Pyramids
(2) 2021 Data
|


