By Alex White, Head of ALM Research, Redington
For any statistical test, we need a null hypothesis. A Sharpe ratio of 0.2 is broadly in line with very long-term equity data, so would represent a worthwhile risk-return from alpha. Some managers over some periods will have performed far better than this - but the point is a Sharpe of 0.2 is still well worth having. If we test managers for a Sharpe ratio of 1, and they fail because they run at 0.2, they’re still likely to doing a useful job in your portfolio. So, what level of annual underperformance do you need to show that your manager is not that skilled?
We can run a T-test against this null hypothesis. Taking standard confidence levels, we look at being 80% sure and being 95% sure, so to significance levels of 20% and 5%. But there are some serious issues with this test
Firstly, if you’re testing whether underperformance is serious enough to prove a lack of skill, it’s likely that you’re looking at a manager who has underperformed. In exactly the same way that databases of self-published data are likely to imply managers are better than they are, only looking at underperformers is likely to imply managers are worse than they are. Similarly, if you have 20 managers with uncorrelated alpha, all generating a 0.2 Sharpe, one of them is likely to fail. So, there are sources of survivorship bias inherent in any test of this type.
What this all means is that the test is fairly harsh on managers. Say the test implies that active returns of - x% make us 95% sure that the manager does not have enough skill to earn a 0.2 Sharpe; if we accounted for negative survivorship bias, that - x% would have to be even more negative.
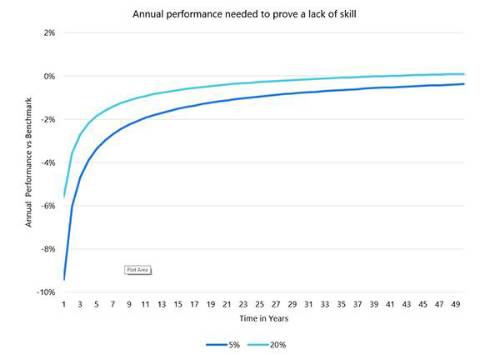
So, what do we get? The graph below shows how much underperformance you would need, with a 5% tracking error, to show that the manager lacked skill. There is an important caveat here, that the underperformance must be relative to the appropriate benchmark. In particular, a manager with a style bias should be judged against a style-biased benchmark, or assumed to have an appropriately higher tracking error.

What is clear is that these numbers are large. You may need 20 to 25 years of negative 1% returns to draw strong conclusions. By which time it may well be too late to replace them; besides which, the manager will be different people using different systems and processes anyway, and the early data may be much less relevant. It is hard to prove a lack of skill.
So what can you do? You can’t wait for the performance data to come in, which means (absent extreme losses), you probably shouldn’t fire a manager purely off the back of a bad year, or even a bad few years. What you can do though is judge whether your manager is doing what you hired them to do. For example, if you hired a value manager and analysis of their portfolio found an abundance of growth stocks, that might be a more meaningful flag. But purely looking at past performance is unlikely to be an especially reliable guide.
|

