 By Matthew Edwards, Towers Watson By Matthew Edwards, Towers Watson
The use of predictive modelling techniques to refine the pricing of insurance risks has been standard practice in the P&C insurance sector for many years. However, life organisations have traditionally used simple one-way techniques and so, for many life insurance providers, predictive modelling techniques represent a new era of modelling. The aim of a predictive model is to derive a meaningful relationship between the modelled event (for instance, death or surrender) and various explanatory factors (for example, age, policy duration, or postcode group).
This provides enhanced understanding of the underlying risk drivers, and is a vital input in pricing business in competitive sectors – especially where competitors are pricing on a segmented basis (for example, pricing annuities according to postcode or fund size).
Traditional approaches have attempted to explain the modelled event using a very small number of explanatory variables. But they frequently fail to allow for the effect of correlations in the data, and this can often lead to material misunderstanding (and hence mispricing) of the relevant risks.
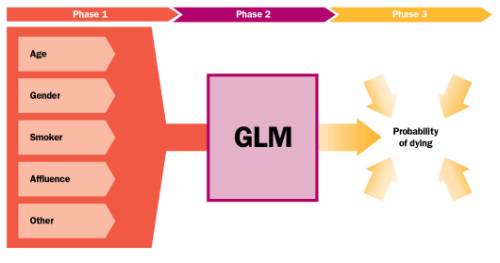
In response, many life insurers have recently started to use ‘multi-dimensional’ predictive techniques such as Generalised Linear Models (GLMs), which allow a number of factors to be analysed simultaneously. The factors can include data held by the provider such as customer age and policy duration, as well as externally available data such as geodemographic, lifestyle or investment market data. By capturing a greater number of variables, and allowing for correlations and interactions between them, GLMs are able to identify and quantify the true effect of risk factors on the modelled event.
Figure 1. What is a GLM?

Mortality Analysis
The use of GLMs in analysing a life insurer’s mortality experience is becoming increasingly widespread. By fully identifying and quantifying all available explanatory factors – beyond what is typically assumed by a traditional one-way mortality analysis – the insurer can develop premiums that accurately reflect the relative risk characteristics of the pool of underlying policyholders.
Where traditional analyses are restricted by concerns about time trends in the data, the use of ‘calendar year of exposure’ as a factor allows these trends to be captured explicitly, permitting the use of many more years of data than would otherwise be considered safe and thus allowing companies to absorb more from their data. This is particularly relevant in relation to mortality investigations where mortality improvement assumptions need to be quantified. By introducing interactions into the GLM, such as interactions between pension amount and calendar year of exposure, or between sex and year of exposure, these trends can be considered in more detail than might otherwise be feasible.
As well as using GLMs to automatically fit to the most appropriate mortality rates, GLMs can be used to produce bespoke mortality tables for a portfolio should the standard mortality tables not provide a good fit. An individual’s postcode, shown to be a valuable predictive proxy for underlying health and ‘health behaviour’, has also been successfully used in recent years as a rating factor in GLM analyses, which can help better reflect the mortality characteristics of the underlying data.
Retention analysis
With increasing competition in the life sector and,correspondingly, reduced product profit margins, life insurers are turning increasingly to their in-force books in a search for higher profits. What are the drivers underlying policyholders’ lapse or surrender decisions? GLMs provide a natural tool to answer such questions, given their ability to analyse large numbers of factors.
Such an analysis can reveal how previously overlooked parameters, such as age, socioeconomic characteristics or distribution source, may affect policyholder behaviour.
The ability of GLMs to allow correctly for correlations in the data and for possible interaction effects between factors allows firms to develop more accurate behaviour models. For instance, firms can see how the duration effect might differ between different commission structures, or between different distribution channels.
Proper consideration can also be given to any geographical/socioeconomic effect, via either overlaying socioeconomic postcode categorisations, or studying the observed high and low retention postcode clusters derived from the portfolio’s experience. Additionally, where a key measurable is fund outflows rather than policy movement, a GLM can explicitly capture the effect of the benefit amount.
As with a mortality analysis, it is possible to improve understanding of how observed calendar year of exposure effects in a portfolio relate to external factors, such as relevant economic indices.
It is worth noting that one of the potential constraints to using GLMs in the life sector – having too few observed events – generally disappears with lapse and surrender analyses, since most companies will have sufficient volumes of responses to support a meaningful analysis.
Conclusion
Within the last decade, the insurance industry has seen GLMs transform from a technique used almost exclusively in the P&C insurance practice to one considered to be an optimal solution for experience analysis of life insurers. By combining the right GLM modelling tools, good data and analytical skill, life insurers have been able to gain and retain competitive advantage. And with a global trend towards increased sophistication of risk models, behaviour models, and optimisation, we expect the rise of the life GLM to continue.

|

