|
|


 The Continuous Mortality Investigation (CMI) has proposed major changes for the next version of its Mortality Projections Model. We supported the CMI with its analysis and decision-making, but this blog reflects our own view rather than the CMI’s. The coronavirus pandemic was a serious challenge to the CMI Mortality Projections Model. A key principle of the model is that recent mortality rates are a good guide to the short-term future. That worked pretty well up to 2019, but the pandemic changed that. |
By Jon Palin, Partner and Senior Longevity Consultant at Barnett Waddingham The jump in mortality in 2020 was exceptional and not indicative of the short-term trend, as we hope it will be decades before another pandemic of that size. The pandemic led the CMI to make a series of changes to the model. CMI_2020 and CMI_2021 were relatively straightforward, as the CMI ignored the extreme mortality data for 2020 and 2021. However, CMI_2022 and CMI_2023 were more of a challenge as the industry debated whether mortality rates in 2022 and 2023 were further outliers or the start of a new trend. The CMI gave data for 2022 and 2023 partial weight in the model, focussing on a plausible outcome for cohort life expectancy rather than a realistic path for mortality. That wasn’t unreasonable, and the model continued to be widely used. But there was unease from the CMI and model users about the level of subjectivity and the difficulty of understanding what a partial weight really meant. We saw a range of views in the industry and a number of insurers in particular taking a different approach. The CMI’s proposal for CMI_2024 represents the biggest shake-up of the model since CMI_2016 and aims to return the model to a more data-driven approach.
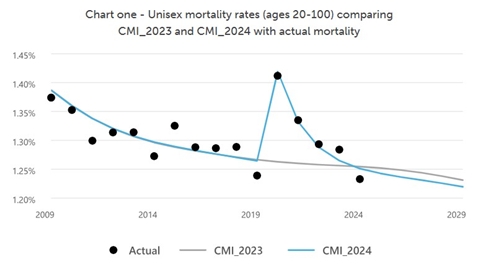
Explicitly modelling the pandemic This is achieved by simultaneously fitting ‘underlying’ mortality and an ‘overlay’ for the pandemic, while giving full weight to every year’s data. The overlay applies from 2020 and models the short-term impact of the pandemic, while the underlying reflects longer-term changes in mortality. Chart one shows how the CMI_2024 proposal models the shape of mortality through the pandemic, while CMI_2023 smooths through it.
Source: BW calculation based on CMI Working Paper 197 We know of some firms that have modelled the pandemic by taking a view of underlying mortality purely based on pre-pandemic data and then adding an overlay to that. In that case, the underlying mortality would never reflect changes in economic, social, or medical trends since 2019. In contrast, a key feature of the CMI proposal is that both underlying mortality and the overlay take account of more recent mortality data and will adapt as further data emerges. The CMI’s proposal is that the overlay halves each year. So overall mortality is about 12% higher than underlying mortality in 2020, about 6% higher in 2021, and by 2024 the difference is less than 1%.
The half-life assumption
Variations by age
Other populations Similarly, caution will be needed if using the model for international data. The pandemic didn’t cause a material jump in mortality in Australia until 2022, and the Netherlands has seen a slow decline in excess mortality, with the Dutch actuarial profession effectively using a half-life of around 2.4 years.
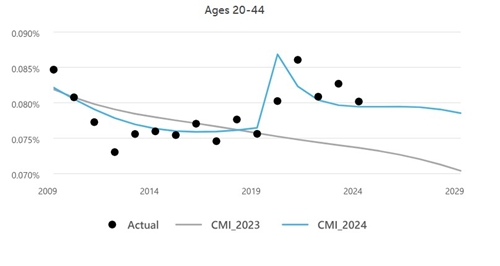
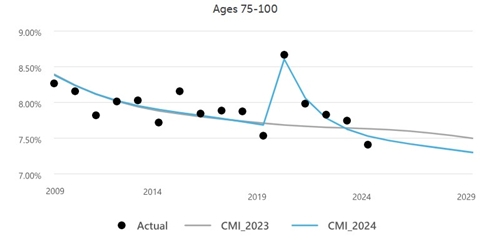
Better modelling of trends at different ages The CMI’s analysis shows that while mortality for older ages hit a record low in 2024, that was not the case for younger ages. Mortality for ages 20-44 was lowest in 2012 and mortality for those ages in 2024 was higher than in any year from 2011-2019. That was a challenge for the existing model, which expresses mortality as a combination of terms that vary by age, calendar year (period), and birth year (cohort). With only one period term, trends over time reflected a broad average of trends at all ages. The proposal for CMI_2024 is to extend the model to have three period terms, corresponding to young, middle, and old ages. That allows the model to simultaneously reflect mortality falling at older ages but rising at younger ages, rather than averaging the trends. Chart two has the same format as chart one, but shows how patterns of actual and fitted mortality differ for younger ages (20-44) and older ages (75-100). Mortality at younger ages under the CMI_2024 proposal is much higher than for CMI_2023, reflecting recent mortality being persistently higher than years before the pandemic. But mortality at older ages is lower for CMI_2024 than CMI_2023, leading to higher cohort life expectancy than CMI_2023 at older ages.
Source: BW calculation based on CMI Working Paper 197 The specific implementation of the three period terms leads to a kink in the age-period component of mortality improvements at age 60. The CMI could consider a slightly different method to smooth that out, but that shouldn’t detract from the wider benefits of three period terms.
Refinement of cohort constraints Previously, the constraints were applied during the fitting process but taking the same approach for CMI_2024 would have led to the constraints having a material and undesirable impact on cohort terms at older ages. To avoid that, the CMI proposes to apply the constraints as a separate step after the main fitting process, rather than during it. That seems a sensible approach and is similar to the method used for earlier versions of the model from CMI_2009 to CMI_2015.
A smarter approach to calibration The proposed method uses an approximation to the existing Poisson measure of deviance (i.e. the goodness of fit to the data) and then a refinement of that approximation to fit the model more quickly and robustly than before. The approach could be adapted to other models, including the Cairns-Blake-Dowd family, and be of particular use when looking at risk and Solvency II capital, as this can involve re-fitting a model many times to stochastically generated data. Another fringe benefit of the new method is the possibility of better understanding of the model. The large matrix used to fit the model under the new approach relates the parameters to the calibration data and could offer insight into the practical impact of the somewhat abstract smoothing parameters.
Review policy creates clarity and consistency
It’s setting guidelines rather than rules, to avoid tying its hands, and notes two numerical triggers that would cause it to consider a change:
The new year’s mortality being more than 3.5% from the previous trend; or
Cohort life expectancy changing by more than 0.5% compared to the previous model.
That’s helpful to see and should provide greater clarity and predictability for users, particularly as they can track emerging mortality using the CMI mortality monitor.
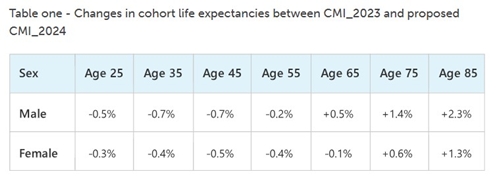
How will these changes impact life expectancy? Cohort life expectancy for a typical annuity portfolio would increase by around 1% between CMI_2023 and CMI_2024, but the impact on a typical insurer may be less as insurers have tended to adopt a more cautious parameterisation of CMI_2023.
Overall, a positive step for mortality modelling
It’s good to see the CMI responding to some of the criticism of CMI_2023, effectively retiring the use of weights, which were hard to interpret, and setting out a sound basis for future versions of the model.
An increase in life expectancy for typical pensioner and annuity portfolios compared to CMI_2023 is reasonable. This partly reflects lower mortality at those ages in 2024 but also the ability of the proposed model to better reflect stronger mortality improvements at older ages compared to younger ages. While there will undoubtedly be some points of debate during the consultation, including the choice of half-life, the proposals are welcome. We’ll hopefully see more of the industry using the model more directly, albeit with their own parameter choices, rather than the more fragmented approach of recent years. But a key challenge will be basis risk, and how appropriate an overlay calibrated to the general population will be for specific portfolios. |
|
|
|
| Take the lead client-facing projects ... | ||
| Various locations - Negotiable | ||
| Choose Life! Choose a major global co... | ||
| Various locations - Negotiable | ||
| Actuarial skillset? Apply now for Snr... | ||
| South East / hybrid with travel requirements - Negotiable | ||
| Financial Risk Leader - ALM Oversight | ||
| Flex / hybrid - Negotiable | ||
| Be the very model of a modern Capital... | ||
| London - Negotiable | ||
| Pensions Actuary seeking a high-impac... | ||
| London or Scotland / hybrid 3dpw office-based - Negotiable | ||
| Great opportunity for Pensions Actuar... | ||
| London or Scotland / hybrid 3dpw office-based - Negotiable | ||
| Responsible Investing Manager - Clima... | ||
| London/Hybrid - Negotiable | ||
| Quant Strategist | ||
| London/Hybrid - Negotiable | ||
| Multiple remote longevity contracts | ||
| Fully remote - Negotiable | ||
| Multiple remote inflation hedging con... | ||
| Fully remote - Negotiable | ||
| Play a vital role in shaping a new He... | ||
| London or Scotland / hybrid 50/50 - Negotiable | ||
| Support the Longevity team of a globa... | ||
| London / hybrid 2 days p/w office-based - Negotiable | ||
| Delve into financial risk within a ma... | ||
| Wales / South West / hybrid 1dpw office-based - Negotiable | ||
| Project-based Life Pricing Actuarial ... | ||
| South West / hybrid 2 dpw office-based - Negotiable | ||
| Pricing Actuary | ||
| London - £120,000 Per Annum | ||
| Develop your career in motor pricing | ||
| UK-wide / hybrid 2 dpm office-based - Negotiable | ||
| Experience real career growth in home... | ||
| UK-wide / hybrid 2 dpm office-based - Negotiable | ||
| Be at the cutting edge of technical p... | ||
| UK-wide / hybrid 2 dpm office-based - Negotiable | ||
| Use your passion for innovation and t... | ||
| London / hybrid 2 days p/w office-based - Negotiable | ||


Be the first to contribute to our definitive actuarial reference forum. Built by actuaries for actuaries.
Copyright © 2026 Actuarial Post. Created by Zero-One Design Ltd