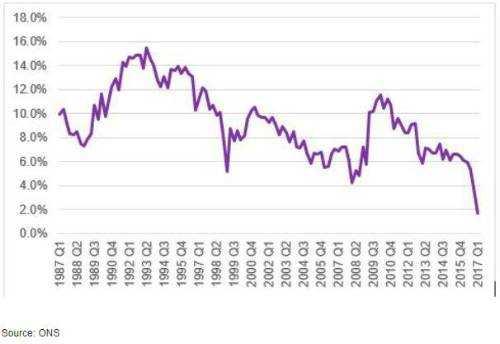
In June 2017, the Office for National Statistics published its estimates for the ‘savings ratio’ for the first quarter of 2017. This is essentially a measure of the percentage of household income which is not going into current spending. The figures for Q1 2017 showed a sixth consecutive quarterly fall with a record low savings ratio of 1.7%, compared with 3.3% in Q4 2016 and 5.3% in Q3 2016. The chart below shows the long-term trend of quarterly savings ratio data, and highlights the dramatic recent movements:
Figure 1. Quarterly savings ratio 1987 Q1 to 2017 Q1

These figures have generated much discussion as to why consumers are apparently ‘no longer saving’. However, a new Royal London policy paper “Has Britain really stopped saving?” casts doubt on whether this is a correct interpretation of the data and warns against policy makers jumping to the wrong conclusions based on the headline data. In particular, this is because the savings ratio calculation includes not just households’ day-to-day savings, but also the increase (or decrease) in the value of their pension funds, a factor which appears to be driving much of the recent fall.
The key findings of the paper are:
- The Q1 2017 figure was distorted (as ONS accept) by people making larger-than-usual lump sum payments of income tax before the January 31 deadline; far from the fall in the savings ratio being a sign of reckless consumption, this suggests that individuals have been carefully setting money aside in order to pay their tax bills; this effect is likely to disappear from the Q2 data;
- Ignoring the distorted data for Q1 2017, for the period from Q1 2014 to Q4 2016, the savings ratio still halved from 6.7% to 3.3%; however, this fall is almost completely explained by changes in the figures for pension savings, and these again provide little evidence of a consumer spending spree; the three main factors driving the fall in the savings ratio over this period are:
A drop in the amount companies were putting in to their defined benefit company pension schemes;
A fall in rates of return on the investments in pension funds;
A rise in withdrawals from Defined Contribution pensions, probably associated with the ‘pension freedoms’ introduced in April 2015; however, analysis by the Financial Conduct Authority suggests that most of this money was used either to pay off debt or was invested in other savings vehicles rather than fuelling a big increase in consumer spending;
- The way that pension saving is measured in the official figures excludes the pension saving of millions of public sector workers who are members of ‘unfunded’ pension schemes; if the savings ratio calculation had included unfunded pensions, the halving of the savings ratio in the three years up to Q4 2016 would have been largely or wholly explained by changes in pension saving, rather than by anything to do with short-term consumer behaviour;
Commenting on the results, Royal London Director of Policy Steve Webb said:‘Recent figures for the headline savings ratio have been eye-catching and seemed to tell a story of a dramatic slump in household savings. But leaving aside short-term factors like people paying lump sum tax bills before the January 2017 deadline, most of the recent change in the savings ratio has been about what is happening in the world of pensions and tells us little or nothing about consumer spending habits. Policy-makers need to be incredibly careful about reading too much into a single headline statistic such as the savings ratio when it may be painting a very misleading picture of what is really going on in UK households’.
Has Britain Really Stopped Saving
|

