By Alex White, Head of ALM REsearch, Redington
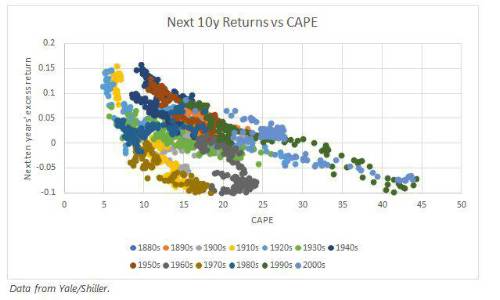
Over the long-term, the negative correlation between CAPE and subsequent 10 year returns has been 45%. We show a graph of the results below, colour-coding each decade to make it more readable.

This is certainly not just luck; something else must explain it. The obvious conclusion is that CAPE can predict equity returns.
But is that the right conclusion? The results pass a simple significance test. But we have to consider what results we would expect under different assumptions.
What if there were no links?
To make sense of any results, it’s worth asking what the results would look like if there were no link. If the ratio had no predictive power, we might expect zero correlation with successive returns. But we shouldn’t.
To explore this, I ran some simulations. I assumed equity prices and real earnings were independently (and log-normally) distributed each month. This ensured that any technical analysis, including CAPE, would have no predictive power. I then ran 1,000 simulated periods of 150 years.
I kept the mean growth the same for equities and real earnings. I did this because, without a broadly equal assumption, there can be no sense of when the ratio is high or low. If equities and real earnings do not grow vaguely in sync over the long-term, then the P/E ratio cannot work through time.
To be clear, this is separate from value investing. I am not considering 2 stocks with different P/E ratios at the same time- rather I am considering an index with different P/E ratios at different times, and the question is whether the P/E ratio can help time equity beta.
Results
With no predictive power, the average correlation was -34%, with a standard deviation of 20%. This means that the seemingly high historical correlation is about 1/2 of one standard deviation away from what you would expect if it had no predictive power, giving a p-value of around 30%. Even though the historical correlation is high, it is not high enough to suggest that the ratio has predictive power.
What’s going on?
It is perhaps counter-intuitive that something built to have no predictive power should show a meaningful correlation with “future” returns. The explanation is that it is not predicting the future, it is predicting the past.
The average of the last 10 years’ earnings does not change much over a short horizon, while the price can change dramatically, so most of the change is coming from the price. This means any justification of the P/E ratio comes down to a justification of some sort of active mean reversion (see my piece from the December 2018 issue), or some sort of fundamental value. For the ratio to work, there must be some “pull to par”, whereby prices bounce around but return to a fundamental, “true” level, which is a function of earnings. This is the ideological backbone of the P/E argument.
One problem with using correlation to measure this is that any historical time series either stops or mean reverts. Whether there’s anything fundamental going on or not, once the returns are realised (and only then) there will be peaks and troughs. Once the data has crystallized, it will go up from its lowest point, and down from its highest.
Realised returns have to do this, by definition. Future returns do not. This means correlation is an inadequate tool for measuring this type of subtle effect.
Takeaways
CAPE may still work, and it makes economic sense (in particular, this test simplifies dividend behaviour). But the seemingly convincing historical correlation with future returns is not evidence of its predictive power. More broadly, data often includes subtle effects like mean reversion and survivorship bias, and this can make interpretation less intuitive.
|

