By Jack Carmichael, Associate and Senior Consulting and Longevity Actuary at Barnett Waddingham
We’ve known for a while that how long a DB pension scheme member lives in retirement can depend on a range of factors, including:
their retirement income;
where they live in the UK;
how affluent the area they live is; and
the industry they mostly worked in.
In the past it hasn’t been clear which of these factors were the most important, and also whether any of these factors that seem important are less significant once we consider the other factors.
A recent analysis of a large group of UK DB pension scheme members sheds some light on the important factors that drives how long DB pensioners live in retirement. In this blog I summarise the analysis and discuss three case studies.
Background and key results of the CMI’s analysis
The CMI is a group of expert longevity actuaries that collects data on UK DB pension scheme members. The CMI uses this data to provide research and analysis to support pension scheme trustees and actuaries when valuing the liabilities of UK DB pension schemes. In its recent analysis, the CMI analysed the data for several million DB pensioners (making it one of the largest datasets in the world that includes a wide range of factors).
The pension scheme industry has been familiar with some of the key conclusions of the analysis in the paper for several years. These conclusions relate to how long pension scheme members are expected to live in retirement based on both their retirement income and the relative affluence* of the area they live, and are as follows:
Male pension scheme members: both the affluence of the area they live and their income are strong predictors of their life expectancy, i.e. if a male pensioner lives in a more affluent area or has a higher retirement income then they are broadly expected to live longer. Female pension scheme members: when both factors are considered together, only the affluence of the area they live has a material impact on life expectancy, and retirement income is no longer a useful factor for estimating life expectancy.
*Affluence is measured using the government’s Index of Multiple Deprivation (IMD) metric of affluence. This metric ranks areas in the UK (each with around 1,500 people living in them) based on a range of factors linked to affluence, including access to services and education levels.
The new analysis involved breaking these conclusions down further to consider other factors that the CMI collects, including the industry that pension scheme members worked in and the UK region in which they lived. Below I discuss three interesting case studies from the analysis.
Financial sector
Previous analysis from the CMI has shown that individuals who worked in the financial sector (for example, banks, insurance companies and in financial services) have tended to live significantly longer than pensioners who worked in other sectors.
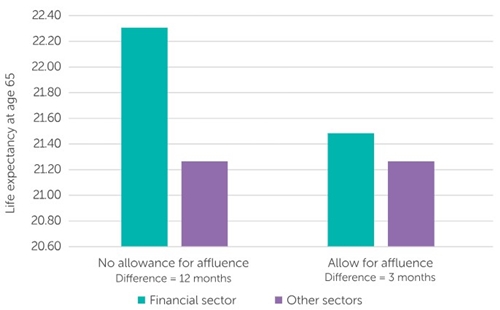
The CMI’s analysis suggests that when you allow for the fact that pension scheme members from the financial sector tend to have higher retirement incomes and live in more affluent areas, the difference between these financial sector pensioners and other pensioners mostly disappears. The following chart shows life expectancy at age 65 for a male pensioner in the financial services sector.

The chart shows that financial sector pensioners tend to live around one year longer in retirement than an average DB pensioner. Allowing for the affluence of the area that pensioners live in and their retirement income reduces the gap to around three months. The analysis therefore suggests that there isn’t an unknown additional factor that is causing financial sector pensioners to live longer than other DB pensioners, and the majority of the gap can be explained by these members tending to live in more affluent areas and having higher average retirement incomes. This is a useful conclusion for financial industry pension schemes, as it suggests that a socio-economic analysis based on postcodes and retirement income should give an accurate idea of the mortality profile of members, without needing to make an additional allowance for a special 'financial industry effect'.
Public sector vs private sector pension schemes
Previous studies of female pensioners by the CMI has suggested that female pensioners who worked in the public sector tend to live longer in retirement than a female pensioner who worked in the private sector. Similar to the financial services sector, it was unclear how much this was caused by working in the public/private sector or by the relative affluence of the female pensioners.
Understanding the cause of this gap is important for both public sector and private sector schemes – both are significant contributors to CMI’s overall dataset and therefore affect the standard set of 'average pensioner' assumptions the CMI provides to the industry through its 'S4' series mortality tables (further information on these tables can be found in our 'Recent developments in longevity' briefing). The issue is arguably more important for private sector schemes, which tend to rely more on socio-economic data than public sector pension schemes, as the size of the public sector pension schemes (some with more than 100,000 members) means they can typically use an experience analysis of actual deaths to set assumptions.
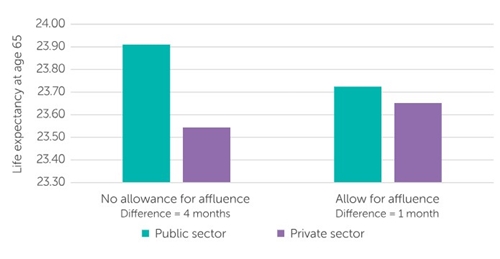
The CMI’s analysis suggests that the difference between public sector and private sector female members appears to be driven by the public sector pensioners generally being more affluent than private sector pensioners. The following chart shows life expectancy at age 65 for public sector and private sector female pensioners, depending on whether affluence isn’t allowed for (left hand side) or is allowed for (right hand side).

The chart shows that once affluence is allowed for, the gap between public and private sector life expectancy for female pensioners falls from around four months to less than a month. This is a useful conclusion for private sector pension schemes in setting assumptions for female pensioners as, similar to the conclusion for the financial sector, it suggests that a postcode and income based socio-economic analysis should sufficiently capture the profile of the female pensioners.
Pensioners in Scotland
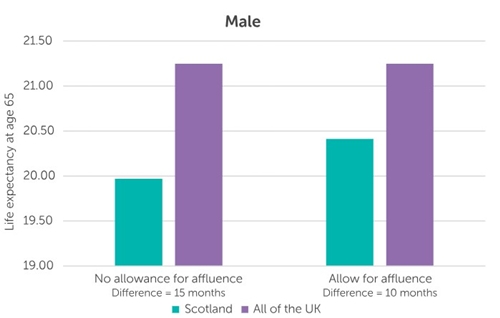
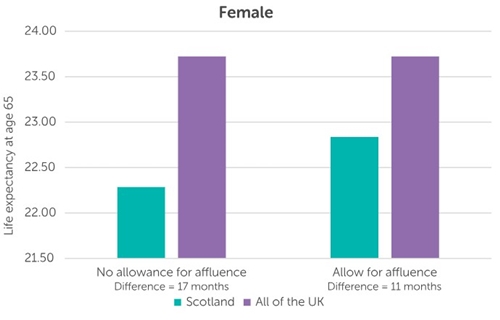
A range of previous studies, both for DB pensioners and the wider UK general population, have shown that the region in the UK in which an individual lives can affect how long they live in retirement. One of the regions where this effect is most visible is Scotland. The following chart shows life expectancy at age 65 for male pensioners (top) and female pensioners (bottom) for Scotland compared to the other regions of the UK. The charts compare life expectancy with no allowance for affluence, and including an allowance for affluence.
The charts show that while allowing for affluence does decrease the gap between Scotland and other UK regions, the gap is still sizable. For males the gap decreases from 15 months to 10 months, and for females the gap decreases from 17 months to 11 months. There could be a number of reasons why this gap remains even after affluence is allowed for:
The most likely reason is that the measure of affluence (IMD) differs between Scotland and other regions of England and Wales. This might mean that IMD is not the best measure to compare the affluence of individuals in different regions. Smoker rates and levels of obesity (both factors linked to an earlier age of death) are higher in Scotland than the rest of the UK. However, it is difficult to know how much of this is caused by difference in affluence (smoker rates tend to fall with affluence) compared to a region-specific difference.
The CMI’s analysis suggests that using postcodes and income based socio-economic analysis won’t fully capture differences in life expectancy seen for pensioners living in Scotland. To reflect these regional differences, pension schemes with a high proportion of members who live in Scotland may want to adjust their mortality assumptions to assume pensioners live shorter than implied.
What should I be thinking about for my pension scheme?
The latest CMI analysis suggests that allowing for the affluence of the area a pensioner lives and their retirement income addresses most of the gaps in how long pensioners live in retirement. This includes the industry in which the pensioner worked and whether the pensioner worked in the public or private sector.
However, the analysis isn’t able to fully address all gaps, such as for pensioners who live in Scotland. For schemes with a significant proportion of members living in Scotland, you may want to consider making an adjustment to the socio-economic profile to reflect the gap identified by the CMI.
|


