By Alexander White, Managing Director, Co-Head of ALM, Redington, a Gallagher Company
Just looking at the chart, it’s clearly pretty spiky, particularly (and unsurprisingly) around the two great credit crashes, in 1929 and 2008.
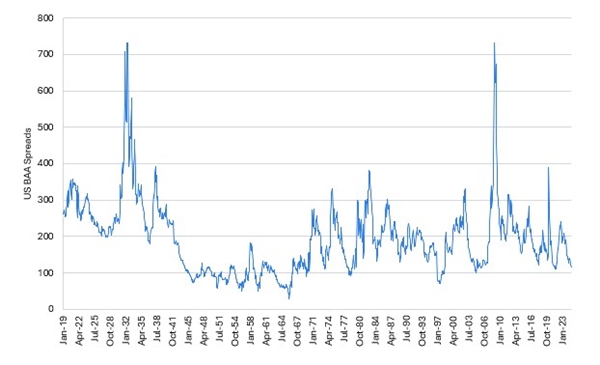
Source data: St Louis FRED, Shiller, ICE; Calculations: Redington
Asymmetry
Looking at the data, the absolute size of annual moves is roughly 50% correlated with initial spread levels, for example spreads move less when they start low.
Does that mean low spread should be safer?
Well, no. If we split spread moves into widenings and tightenings, widenings are only about 25% correlated with levels, while tightenings are -75% correlated. In other words, when spreads are low they can only go down a little, but can still go up a lot. And therefore if prices start high they can only go up a little, but they can fall by about as much (especially when adding in convexity) whether they start high or low. So that’s asymmetry- what about mean reversion?
Active vs Passive Mean Reversion
The trouble with talking about mean reversion is there is no one clear definition, and the term covers a variety of nuances. Because of this, I find it helpful to think of two separate ideas: passive and active reversion .
Passive reversion (or regression) simply means that the average of a large sample will tend to the underlying mean, and this happens basically everywhere. For example, a child with 8-foot parents is likely be tall, but they’ll probably still be shorter than 8 feet.
This is often misunderstood, which plays into the idea of the “player of the month curse” in the Premier League, where a player performs above their mean level briefly, then reverts to baseline for the next month in what looks like a drop in form. This effect is not causal but statistical- a low value does not make a higher future value more likely, but on average both high and low values are followed by more average values.
By contrast, active reversion implies an underlying force “pulling” data back to the mean. For example, imagine two players play a game with hundreds of rounds. After each round, the winner gets a small (but cumulative) handicap for the next round. If they play enough rounds, the handicaps will even out till the next round is basically a 50-50 toss-up. If the winner gets an advantage, we see the opposite effect, which we often see in nature, sport, and business.
Reversion in Spreads
The earnings on a non-defaulting bond paying a fixed amount have active mean reversion, because a fall in price doesn’t change the income or capital expected, so it increases the likely returns from the current price. But that doesn’t mean the spread itself has active mean reversion, just the returns.
How can we tell which is happening?
Well passive mean reversion happens to everything that has an underlying mean, while active reversion doesn’t. The simplest test for active reversion is whether variance is linear with time (or volatility with the square root of time). What we see is a meaningful reduction in volatility for longer periods.
 Source data: St Louis FRED, Shiller, ICE; Calculations: Redington
This means that spreads actively mean revert- and do so quite strongly. Meaning, broadly, that when spreads are low they’re more likely to go up than down(1)
So, when spreads are low, you have all the same risk but less upside, and reversion means spreads are likely to rise. All in all, it may be a good time to diversify away from IG.
(1) Strictly speaking this is weighted by the size of the moves- e.g. they could be 60% likely to tighten marginally, and 40% likely to widen a lot. But broadly it holds
|