By Alex White, Head of ALM Research at Redington
How risk is defined and distilled can make a material difference to client outcomes. While bucketing funds into intuitive risk bands can help create alignment between clients, advisers and regulators, it can also lead to problems, especially when the risk-bucketing methodology is too dependent on a single risk metric. In particular, if a profiling tool changes a fund’s risk, tipping it into the next bucket, advisers maybe prompted to switch into an alternative, seemingly lower risk, fund. The downside is that asset managers have a strong incentive to stay within risk buckets, potentially at the detriment of following their investment convictions.
Take the following example: Suppose the chosen risk metric is 3-year rolling volatility, and a manager is buying high-yield bonds. The overall volatility since 1999 has been 10-11%, so let’s suppose the manager will reduce their allocation when rolling volatility reaches 12% – what would that have done to performance? Left alone, excess returns on the index were 4.1%; but by reducing allocations after a fall (i.e. when spreads were higher), the returns fall to 3.2%, losing 0.9% a year, or c.20% of the returns. And while the risk is lower (9.4% against 10.3%), the difference in the risk reduction is smaller than the returns lost and the Sharpe ratio is worse.
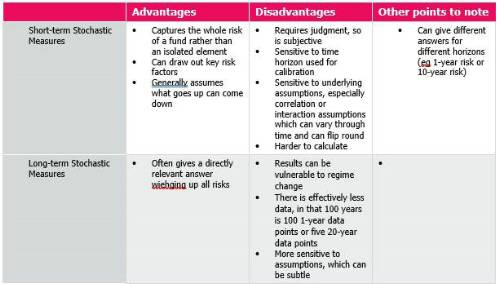
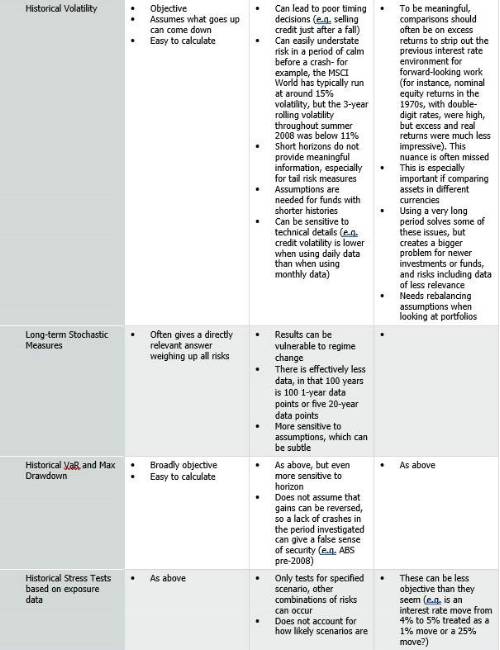
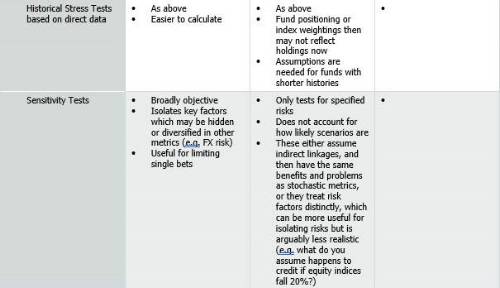
As mentioned earlier, there are many ways to look at risks. The table below highlights some of the trade-offs involved with different metrics. What jumps out is that all metrics have plenty of flaws, so the best way to build a robust portfolio is to use multiple lenses, like stress tests, sensitivity analysis and long-term projections.
|