Private equity can be a great asset. It’s generally the most significant way to have any real world impact as an investor (eg infrastructure assets like renewable power, natural capital, or health- or climate- focused venture capital), and managers typically have more operational control than in public equities, so can do more with it. Moreover, past performance has generally been very strong. However, from a quantitative perspective, private market returns can’t be taken at face value, at least not as a direct comparator with public assets.
|
By Alex White, Head of ALM Research, Redington
The first complication is that infrequent valuations lead to smoothing of returns (as a by-product).
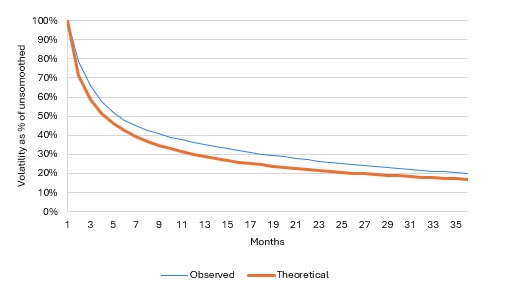
It’s fairly clear that updating valuations less frequently and smoothing returns will reduce volatility, but it’s harder to quantify. To do so, we looked at smoothing monthly returns from 1 month (i.e. no smoothing) to 3 years, both theoretically (assuming lognormal returns) and historically, using the S&P 500 backfilled with data from Yale/Shiller. Even smoothing for just a few months roughly halves the volatility, and smoothing over a year reduces volatility by around 2/3. So any quoted volatility numbers are likely to underestimate risk (relative to liquid assets), and this gives a sense of the magnitude. You can argue which is better- illiquid asset prices ignore a lot of short-term noise and may be better long-term estimates, while liquid asset prices are tradeable and reflect what they could be sold for. Either way, they aren’t directly comparable with each other.
 The second factor is leverage.
With the risk somewhat less obvious, leverage is often higher than in public markets. This is partly a structural advantage- not having the same pressure to pay dividends, for example, means higher leverage is more viable and manageable. This will tend to improve returns, but means comparisons with public equity are often not like-for-like.
The third is well-known: fees.
Private equity typically has high base fees and performance fees. As well as reducing returns, this also creates complications around value through time- for example, a hurdle rate of 8% may have a different impact when rates are 1% then when they’re 5%.
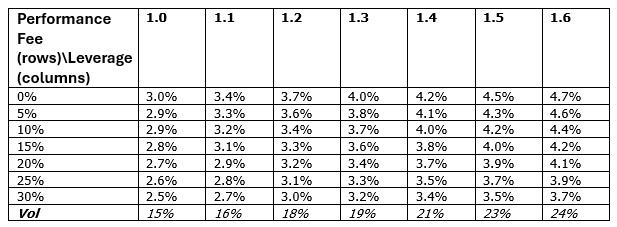
To explore these, again with the S&P/Shiller data set, we look at excess returns with different levels of leverage and different base fees. This assumes a 7-year horizon, 1.5% base fee, a hard hurdle, and assumes the cost of leverage is the risk-free rate, so quite generous assumptions overall (the results are basically linear with base fees). For contrast, the unlevered, gross equity excess returns were 4.5%.

Choice of horizon
The final adjustment, which is harder to quantify, but clearly lends PE a performance advantage. If it’s a bad year, PE will generally wait for a recovery before selling. This is difficult to calibrate precisely, but the ability to wait has value. In the above example, we looked at a simple approach where, if returns were negative, we simply waited up to 3 years. This added around 1 percentage point to the realised annual returns, so even quite a basic approximation can add material value.
None of this means that all PE does is leverage equity, smooth returns and wait before selling. There are sophisticated techniques for performance analysis; and even accounting for these factors, many PE managers have excellent track records that more than cover both these factors and their fees. However, those track records still need to be interpreted in light of these extra considerations, and cannot be treated as if they were tradeable valuations akin to public markets.
|


