Charlie Kefford, a Director at Willis Towers Watson, said: “The aim was to investigate how companies performed against their peers during a period where below average natural catastrophe occurrences and strong competition have led to softening prices in a number of segments, and whilst interest rates have remained at historic lows.”
“The significant performance spread among direct competitors in the UK non-life insurance market over the last five years demonstrates that companies have the ability to break free from the chains of external factors to improve stakeholder returns.”
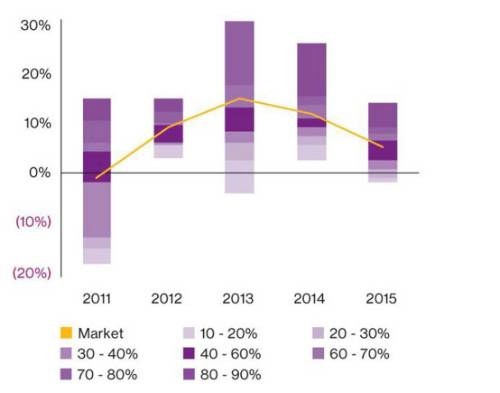
At an aggregate market level, the analysis shows that the UK non-life insurance industry has performed relatively well in the prevailing market conditions compared to other industry sectors, having averaged a return on equity of nearly 8% over the last five years. Figure 1, however, shows the marked variation in performance between individual insurers, which is particularly noticeable in 2011 and 2013, but still amounts to around 15 percentage points between the highest and lowest performing companies in 2015.
Figure 1: Average annual market return on equity and distribution by participant firms

(Source: Willis Towers Watson analysis of PRA returns through S&P Global Market Intelligence)
Charlie Kefford noted: “There is of course no magic formula, but most companies should be able to make gains from re-examining approaches in core areas, including capital, investment, business mix and disposals, reinsurance and uses of technology and analytics.”
Key findings from study:
• Business mix and legacy disposal strategy - The trimming of business portfolios has increasingly become a viable option for differentiating returns, enabling companies to direct their resources towards markets with better growth opportunities, potentially delivering bottom line growth, and almost certainly freeing up capital reserves that, in recent times, have generated lower investment income.
• Technology in the personal lines market - There is likely to be continued momentum growth in motor for the current best performers and those that can adapt quickly to the wider impacts of technology on the risk and the market. Those that have fallen below the current capability curve face the double whammy of remediating performance, plus reductions in the size of the available motor market.
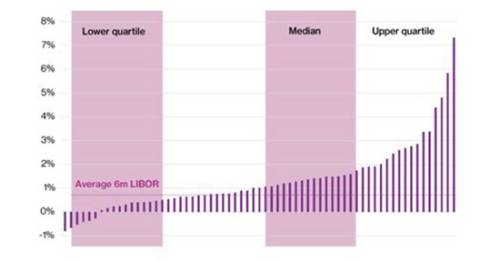
• Investment strategy - Insurer’s returns in 2015 ranged from -0.8% to +7.3% (0% to 13% in 2014) – see Figure 2. Over a third were lower than the average six month UK LIBOR returns for the same period. According to Willis Towers Watson, key drivers of return to consider are: characteristics of the bond portfolio (type, duration); regional allocations and currency hedging; whether asset allocations are dynamic; levels of matching, hedging and other derivatives; use of alternative assets.
Figure 2: Spread of investment returns in 2015

(Source: PRA returns through S&P Global Market Intelligence)
• Capital management - Companies that are outperforming the market are typically making use of a wider array of capital management measures that can be broadly grouped under: leverage - because Solvency II is fairly bullish on debt; avoiding surprise - because investors punish companies for volatility; simplicity - to streamline the balance sheet in order to assist the realisation of value trapped in the business; innovation - typically involving more creative recourse to reinsurance, securitisation and insurance-linked securities.
|

