By Alex White, Head of ALM Research at Redington
Over the same period, a rates rise of just over 1% could mean bond returns of zero. So surely rates will go back up again?
Well, maybe. Or maybe not.
Firstly, we should always be wary of assuming there’s anything unique about the present. While rates look extreme, this has typically been the case historically too1. Perhaps this is counterintuitive and worth explaining:
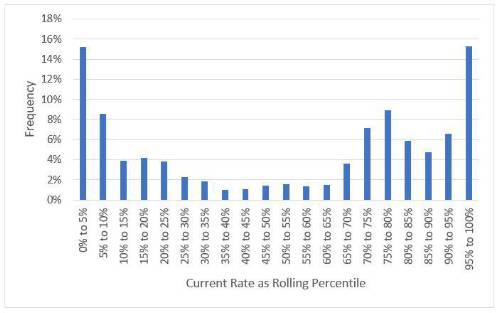
The chart below shows the frequency in which the long-term rate, at any given point, fell into different historical percentiles up to that point.

What we see is that, 30% of the time, rates appear to be in one of the 5% tails. In fact, 17% of the time, the current level has been in the 1% tails, and 14% of the time in the 0.5% tails. So while rates seem extreme, it’s actually quite common for this to be the case.
Still, zero seems qualitatively different from ‘low’ (although it seemed different for real rates too, before they went heavily negative).
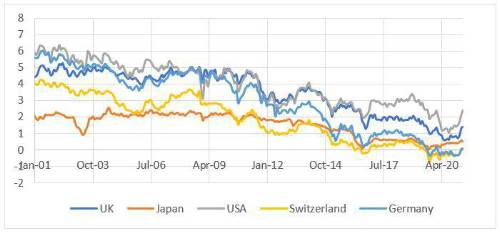
The original cash arbitrage argument – if rates are negative why not just hold cash – has been proven wrong by Swiss, German and Japanese rates in particular. And post-Covid, it has become increasingly clear that simply holding cash is not an implementable solution for large institutions who have to make tens or hundreds of thousands of payments each month (and no, they can’t use bitcoin either, at least not now).
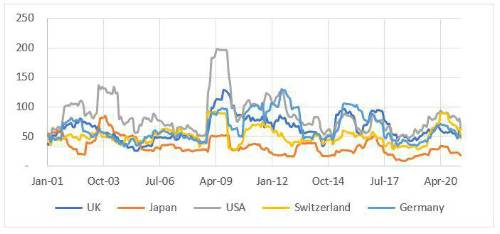
We might still be near a floor, even if the floor is below zero. However, if we were near a floor, we might expect to see rate moves become smaller as they fall. Over the very long term (using Shiller’s data) this correlation is strong, at 56%. However, it’s entirely explained by the late 1970s and early 1980s. For rates below 10%, the long-term correlation is -4%, with recent 12-month volatility greater than the 150-year median.
In a similar vein, we also don’t see any decline in rolling volatility as rates fall – with the telling exception of Japan, where volatility has reduced somewhat since the central bank started targeting zero rates. This could very easily be a precedent, as other central banks could enact similar policies, at which point we would expect rate volatility to decline. Even then, the most likely immediate consequence of a policy shift would be to flatten the yield curve, bringing long-end rates closer to short end levels - which would be good for bond holders
It’s unlikely that bonds will deliver the same nominal returns they have done in the past, but that doesn’t mean you should sell them all just yet.
20-year Interest Rates

Rolling 12-month volatility of 20-year rates

|

