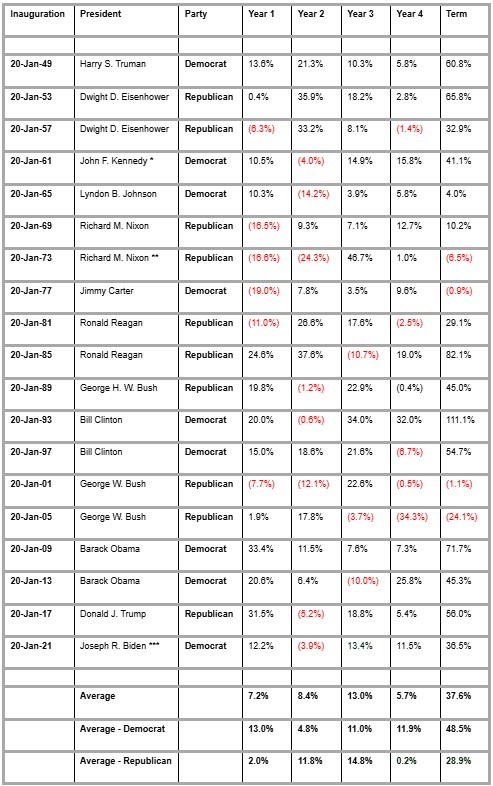
Compared that to the post-war historic average for a four-year presidency of 37.5%, and investors are already wondering what the 60th ballot in US history will mean for them,” says AJ Bell investment director Russ Mould.
“The policies espoused by Donald Trump during the campaign are generally seen as inflationary, thanks to tariffs and onshoring, pro-growth, and as adding to the already burgeoning federal deficit, thanks to proposed tax cuts. How these policies affect the economic backdrop is likely to be one key driver of US stock market returns in the next four years, but the starting point (from a valuation perspective) is likely to be another. The past is no guarantee for the future, but the US equity market does tend to put in a fairly pedestrian performance during the first year of a Republican presidency, with an average advance of just 2.0%, but then Trump is hardly a typical hair-shirt Republican who focuses on fiscal probity.

Source: LSEG Refinitiv data. Based on calendar year from inauguration day (20 January) and the performance of the Dow Jones Industrials index.
*John F. Kennedy assassinated in November 1963 and replaced by Lyndon B. Johnson.
**Richard M. Nixon resigned August 1974 and replaced by Gerald R. Ford.
***Joseph R. Biden’s first term concludes on 19 January 2025.
“Nor should investors forget that Trump was perceived as a risk to markets before his election in 2016, thanks in particular to his policies on trade and international relations, only for US stocks to enjoy strong gains during his term. As such it may not pay to get too caught up in the identity of the winner or their party affiliation. The presidencies which showed the best returns were the first terms of Barack Obama and Bill Clinton, both Democrats, and the second of the Republican Ronald Reagan.
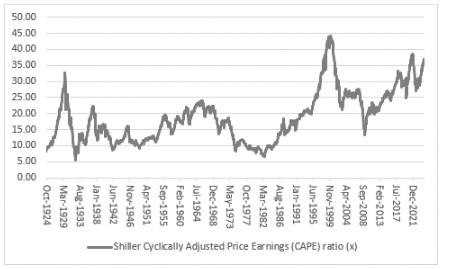
“In all three cases, the US was emerging from a recession, an equity bear market or both and as a result share prices were relatively depressed and valuations manageable or even lowly. Based on Professor Robert Shiller’s cyclically adjusted price earnings (CAPE) ratio, the US equity market traded on 10.0 times (Reagan), 21.1 times (Clinton) and 15.2 times (Obama). By contrast, the only four presidential terms to show a negative return were those of Nixon (and his successor Ford), Jimmy Carter, and both terms of George W. Bush, so three Republicans and one Democrat. On each occasion, a recession or inflation (or both) hit and those shocks came after a strong run in US equity prices, with the result that the valuation starting point was often much higher – 18.7 times under Nixon, 11.4 times under Carter, 28.6 times the first time around under George W. Bush and 26.6 times the second time.

Source: Shiller Data
“It is therefore worth bearing in mind that the Dow Jones is up by 24% in the past year alone, and the S&P 500 is up 32%. Based on Professor Shiller’s work, the CAPE ratio is currently 36.4 times and US stocks therefore look expensive relative to their history. “The starting point for investors under the next president may not therefore be particularly helpful. Any unexpected shocks, such as those suffered during the Nixon, Carter and Bush presidencies, or simply a divergence from the current narrative of cooling inflation, a soft economic landing and lower interest rates, could therefore have a sizeable impact, and not necessarily a positive one.
“Federal Reserve policy could then be a huge factor here and the central bank is independent – although some may be tempted to argue it caved into presidential pressure from Donald Trump when it pushed through three interest rate cuts in 2019. “Others will note the Fed’s willingness to intervene, in size, in 1998, 2001-03, 2007-09 and 2020-21 via interest rate cuts and bond-buying Quantitative Easing schemes upon signs of dislocation in financial markets.”
|


