By Alex White, Head of ALM Research at Redington

Spread behaviour has been asymmetric
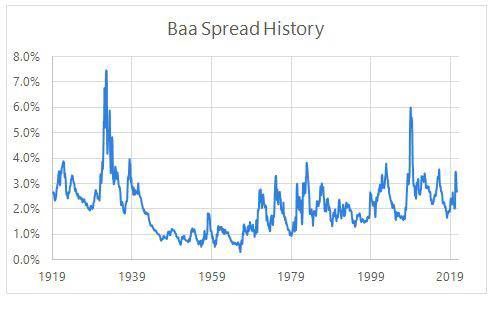
Intuitively, wider initial spreads may mean larger subsequent moves. If a spread is wide, it has more room to tighten, each basis point move has a smaller PV effect (by convexity), and it suggest a more nervous market. And at first blush, this holds- the size of absolute annual spread moves has been 50% correlated with the initial spread level.
However, it’s not an even split. If spreads are 300, they can tighten to 100, whereas it’s harder to see spreads tightening from 100 to -100. Most of it that correlation comes from tightenings (69% correlation), while widenings are much less correlated (28% for absolute moves, -21% for log moves).
This is significant, but weak, and suggests that:
• higher spreads only weakly predict larger widenings (and assuming moves are proportional to initial spread would overstate this effect)
• spreads can widen far from low initial spreads
Spreads have generally risen before defaults, but overcompensate default losses
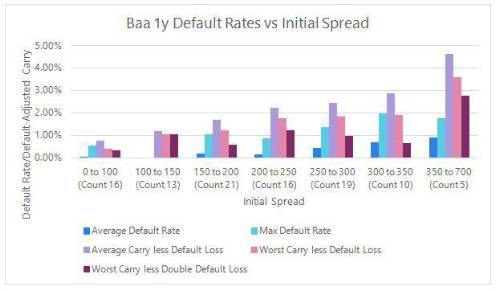
Cross-referencing against Moody’s data, we can see spreads tend to rise in advance of a spike in defaults – spread levels are 55% correlated with subsequent defaults.
So higher spreads have implied higher defaults. However, we can also consider whether the extra spread provides compensation for this. We take a “buy and hold” view and compare the losses from defaults with the spread earned on non-defaulting bonds. We assume a 40% recovery rate, in line with history. The count shows the number of calendar years in each bucket.

A few things to note:
• We’ve taken the recovery rate simplistically- in reality, each default costs more when spreads are lower as the recovery is on the notional value, and the initial PV would generally be higher relative to the notional
• Carry – defaults has always positive, meaning historical negative returns have come from spread moves (and potentially index changes).
• This does only consider defaults over the year. Bonds may be downgraded one year and default the next. This is a serious caveat, as IG investors can easily lose more through downgrades than defaults, and on average, c6% of Baa bonds are downgraded each year.
On a mark-to-market basis, we may well understate this, but on a buy-and-hold basis we can capture this somewhat by comparing multi-year default rates with extrapolated 1y default rates. On a 5 to 10-year horizon, actual Baa defaults are about double extrapolated one year defaults (because bonds often get downgraded first), so, illustratively, we also show the results when doubling the default losses
• The spread has overcompensated investors for default risk by more when spreads have been higher
Spreads have mean reverted
In the previous chart, we ignored valuation changes from other factors, such as spread moves. This is partly a data constraint (eg we would have to approximate durations), but the previous analysis would be biased if we looked at straight performance. For example, since spreads are below 400, we know that every time spreads have been above 400, they have since tightened. That doesn’t mean they had to at the time.
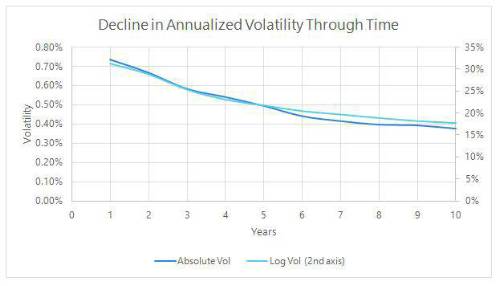
However, we can look for mean reversion. Whether we consider absolute or proportionate moves, we see a steady and material decline in annualized volatility over longer periods- falling by around 50% over 10 years. This doesn’t tell us what, if any, underlying mean they revert to. But it does suggest that if spreads are very wide, they’re more likely to tighten, and if they’re tight they’re more likely to widen.

In conclusion then, higher spreads do imply higher expected defaults, but not by enough to offset the higher spread, even without allowing for spread movements. Spreads mean revert, and offer ample compensation for defaults. Overall , IG credit investors are probably more likely to lose money when spreads are low than when they’re high.
|

